
The National Weather Service tweeted out a chart on Wednesday showing how incredibly unstable the atmosphere was over the Dallas-Fort Worth area on Wednesday afternoon. The region had CAPE values above 7,000 j/kg, which is an extreme amount of instability. Meteorologists and weather enthusiasts gawked over the chart while lots of other folks asked, with a touch of nervousness, exactly what it meant. CAPE is one of those terms we use so often in the weather that it’s easy forget it’s inside baseball to folks who only casually follow the forecast.
CAPE, an acronym for Convective Available Potential Energy, is a measure
of how much instability there is in the atmosphere. Greater CAPE values
indicate a greater potential for powerful thunderstorms. We measure
CAPE in joules per kilogram (ex: 1,234 j/kg), but the unit doesn’t
really matter. It’s all about the number.
Rising Air
Much of what we know about instability in the atmosphere relies on parcel theory. Imagine a bubble of warm air rising from the surface. Since the warmer bubble of air is less dense than the surrounding cooler air, the warmer air will continue to rise like a balloon.
Rising air cools off slowly, so it stays warmer than the air around it as it ascends. The greater the difference between the temperature inside that rising bubble of air and the air around it, the faster that bubble of air will rise. The air doesn’t stop rising until it cools down enough that matches the temperature of the surrounding air and loses its positive buoyancy.
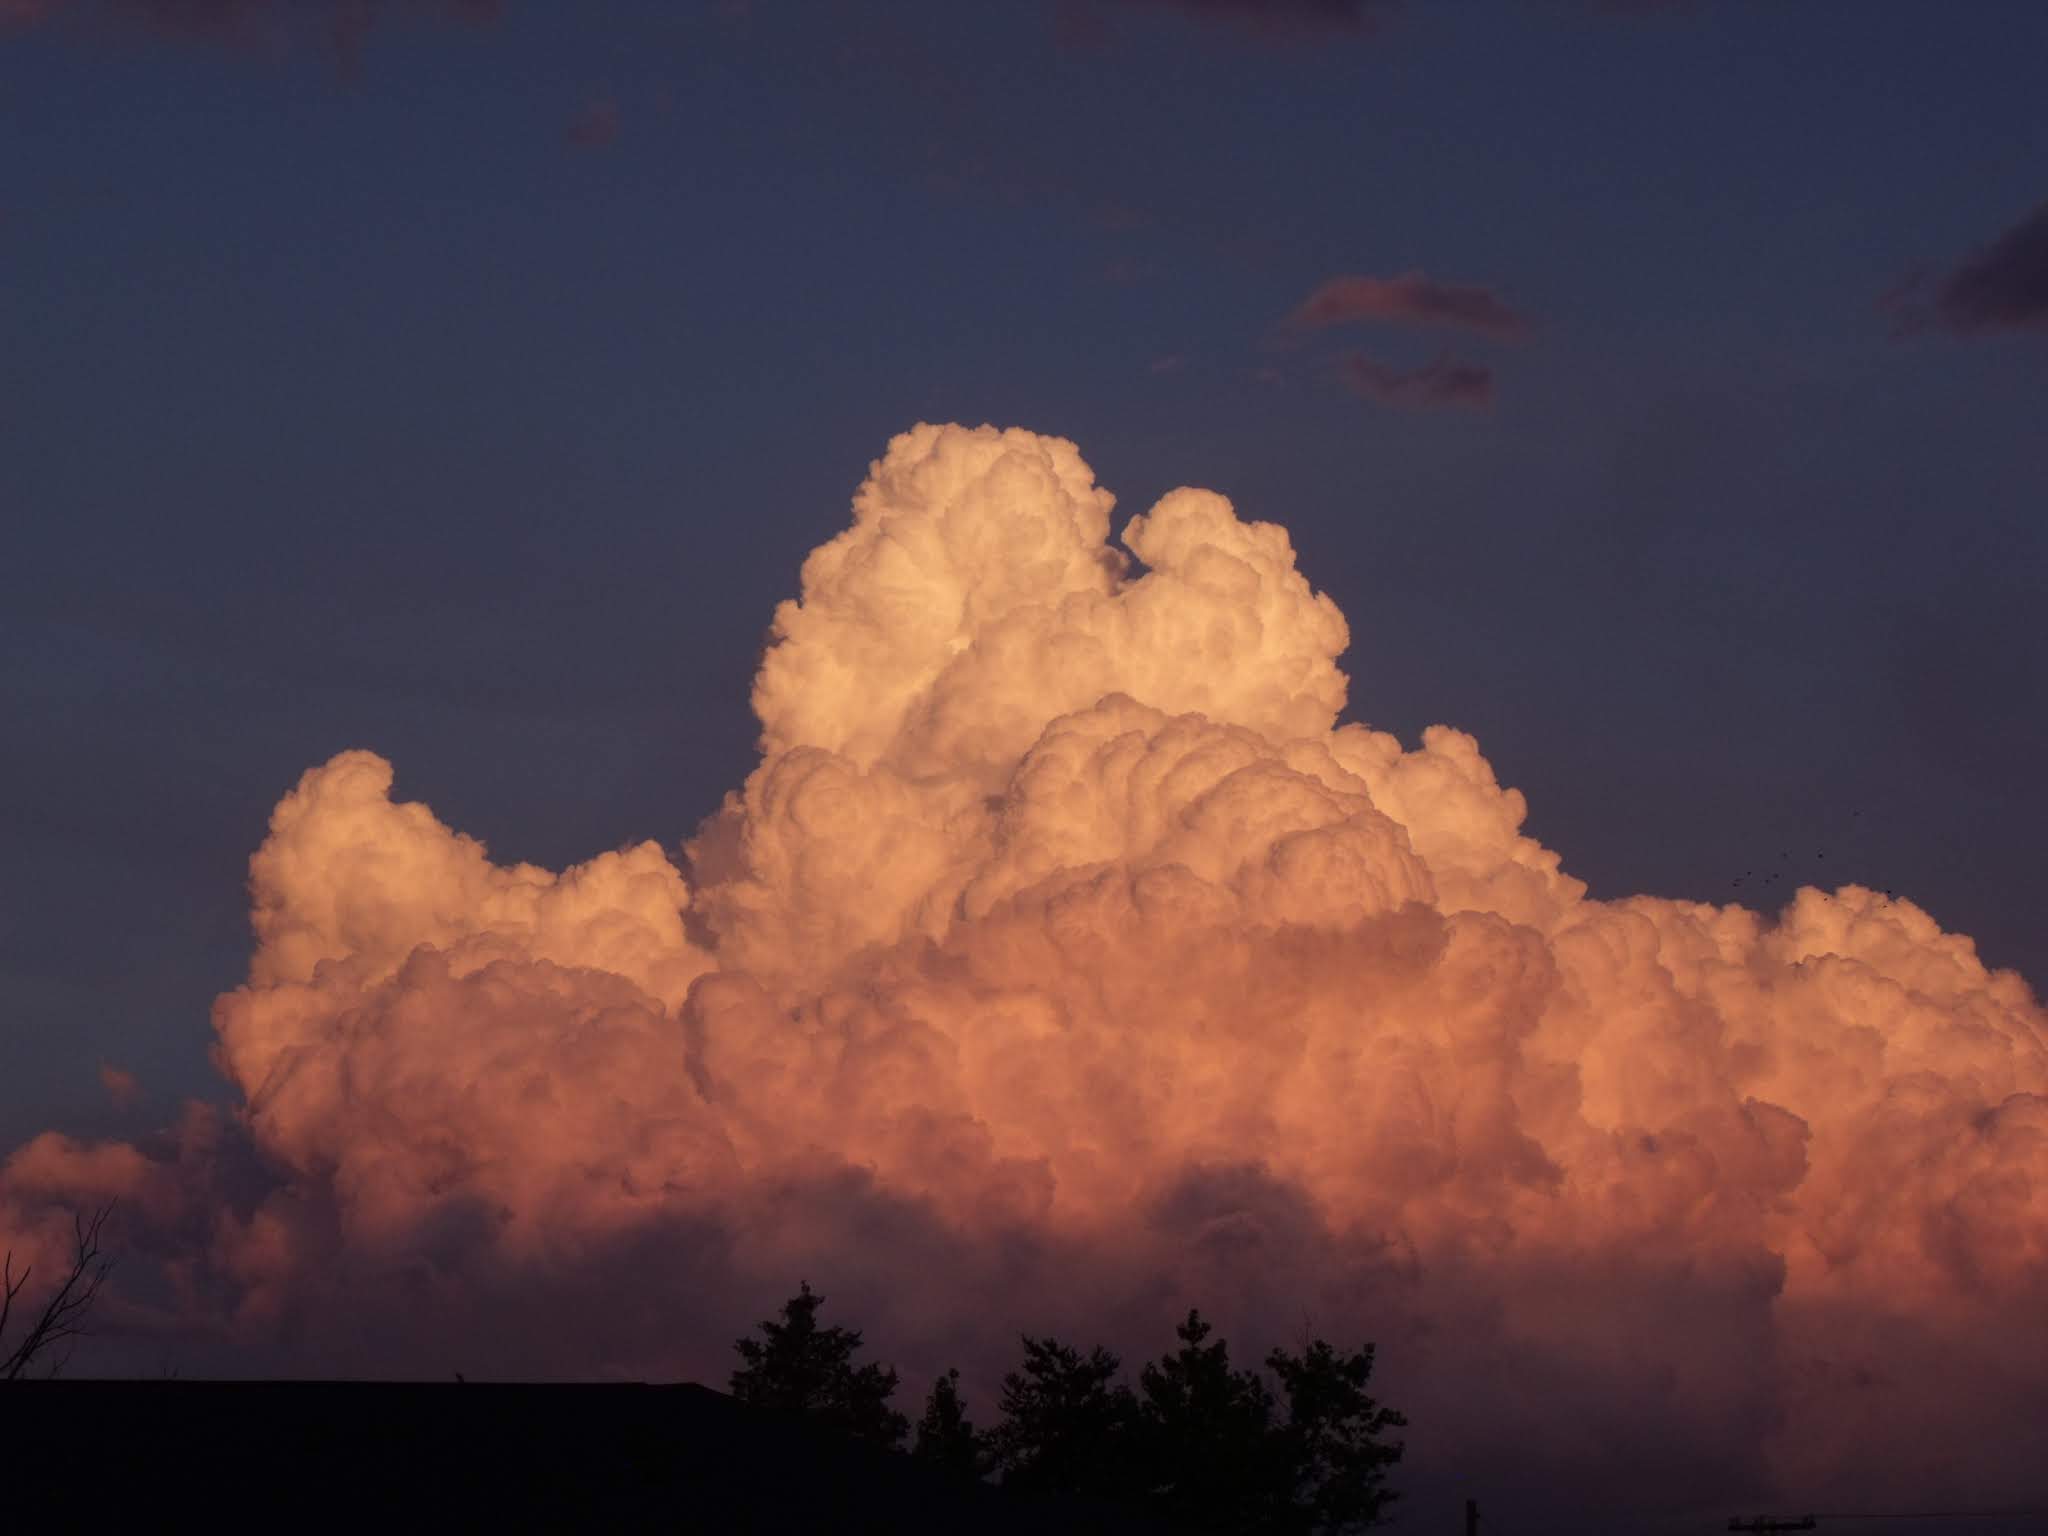
That rising bubble of air is the updraft that produces thunderstorms. When you watch a huge cumulonimbus cloud billowing on the horizon, you’re watching parcel theory in action. Warm air continues racing upward until it cools off and stops rising. (Air spreading out when it stops rising creates the anvil we see at the top of storms.)
SKEW-T Charts

Meteorologists use SKEW-T charts to visualize temperature and moisture throughout a column of the atmosphere. This data can be collected by radiosondes attached to weather balloons or simulated by weather models. Some of these charts are simple and only feature a couple of lines, while others (like the graphic above) are rich with more data analysis than most people ever need.
- The solid red line shows the air temperature measured by the radiosonde attached to the weather balloon.
- The solid green line shows the dew point measured by the radiosonde attached to the weather balloon.
- The dotted red line on the right shows the temperature inside a bubble of air rising from the surface.
- Heights are measured using air pressure along the y-axis; the pressure decreases quickly from bottom to top, mirroring how rapidly the atmosphere thins out with height.
- Temperatures are plotted along the x-axis using diagonal lines that stretch from bottom-left to top-right. I highlighted a couple of the lines in purple to make them easier to spot.
- Winds are plotted at various heights on the right using traditional wind barbs.

All we have to worry about here is the difference between the environmental temperature and the temperature of that rising bubble of air. The big gap between the two temperatures is CAPE. The taller and fatter that blank space gets, the faster the air can rise and the stronger any thunderstorms can grow.
That environment produced numerous reports of significant severe weather, including multiple instances of softball-size hail. It takes a strong updraft to be able to keep such a huge chunk of ice suspended in the air, and CAPE values greater than 7,400 j/kg were, uh, plenty robust enough to allow that to happen.
You don’t always get the whole story on instability from CAPE. Another
important factor is the rate at which the environmental temperature
decreases with height, which is known as a lapse rate. You could have
decent CAPE—but a mediocre lapse rate—and wind up with a situation where
updrafts struggle to get going.
Not All Environments Are The Same
If everything else is favorable, CAPE is usually sufficient to get a decent thunderstorm going once it rises above 1,000 j/kg. The atmosphere is very unstable once CAPE rises above 2,500 j/kg, and the environment is supportive of big-time thunderstorms once it’s above 3,500 j/kg. It’s rare to see values as high as we saw in northern Texas this week, but it can happen during the hot and humid summer months.
Not all bad thunderstorms require huge CAPE values in order to make a mess of things. Instability is only one part of an equation, and there are plenty of scenarios where thunderstorms can produce damaging winds and tornadoes in environments with relatively low instability.
It’s worth noting that a day with big CAPE can see exactly zero thunderstorms—it is potential energy, after all. Temperature inversions are the most common cause of CAPE failing to produce any thunderstorms. An inversion occurs when temperatures suddenly warm with height. These are often referred to as “capping inversions” because the shallow layer of warm air acts like a bottle cap keeping all that air from rising beyond a certain point, stifling potential thunderstorm activity.
We saw that scenario play out this past May when one of the most dangerous severe weather setups in recent years failed to produce much thunderstorm activity—likely due, at least in part, to an unexpected cap over central Oklahoma.
Please consider subscribing to my Patreon. Your support helps me write engaging, hype-free weather coverage—no fretting over ad revenue, no chasing viral clicks. Just the weather.